
この記事では、data.aws_instancesでIDを収集 → data.aws_instanceでNameタグ取得 → アラーム名に反映という流れで、再利用しやすいTerraform構成を示します。
背景
- 対象となるEC2インスタンスは、既にAWSアカウント内に存在している(Terraformで管理されていない)
- アラーム系のリソースだけを、既存環境に後付けで作成する
以上のようなシチュエーションで、terraformを使って効率よくリソース作成ができないかを考えました。
Terraformで複数のEC2インスタンスリソースをまとめて参照する場合、まず候補になるのがdata “aws_instances”です。
これを使えば、フィルタ条件に一致するEC2インスタンスのID一覧を高速に取得できます。しかし、このデータソースはインスタンスの詳細(特にタグ)までは返してくれません。そのため、Nameタグの値を取得したい場合はIDをキーにしてdata “aws_instance”で個別に詳細を取得する二段構えが必要になります。
2段階のTerraform Data sourcesを駆使して、アカウント内のEC2インスタンスのNameタグ情報を効率的に取得する方法を紹介します。
検証環境準備
既存のEC2インスタンスに後付けでCloudWatchアラームを作る前提なので、アカウント上に複数台EC2インスタンスを作成します。
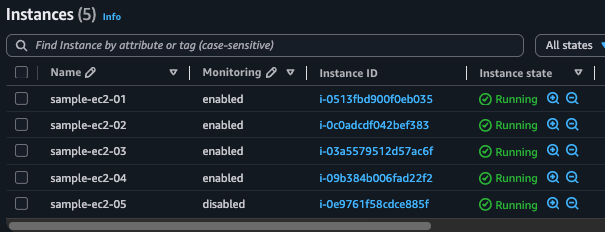
図のように5台のEC2インスタンスを作成しました。
接尾辞の数字をアラーム名に使用する処理をterraformで実装してみようと思います。
また、アラームの作成対象のインスタンスにするかどうかを制御する、Monitoringというタグも設定しました。
Monitoring : disabledになっているインスタンスはアラートの作成対象から除外します。
Terraform作成
早速CloudWatchメトリクスアラームを作成するためのTerraformを作成します。
ディレクトリ構成は以下の通りです。data.tf、main.tf、variables.tf、providers.tfの4種類作成します。
ec2_instances_monitoring/
├─ data.tf
├─ main.tf
├─ variables.tf
└─ providers.tf provider "aws" {
region = var.aws_region
}variable "aws_region" {
type = string
description = "AWS region"
default = "ap-northeast-1"
}
variable "exclude_tag_key" {
description = "監視対象とするかを判断するタグキー"
type = string
default = "Monitoring"
}
variable "exclude_tag_value" {
description = "除外に使うタグの値"
type = string
default = "disabled"
}- data.tf
dataの書き方がポイントです。
理想的には全EC2インスタンスのNameタグの情報を一度に取得できれば望ましいですが、aws_instancesのdata sourcesで取得できるのはインスタンスIDのみです。
そこで、 aws_instanceというdata sourcesを使用します。(名前が似ていますが、末尾に”s”がないものです。)
aws_instanceは、単一のインスタンスを対象に、タグやAMI、VPC設定などを取得するためのデータソースです。
下の例では、data.aws_instances.targets.ids が返す インスタンスIDのリストを toset() でセットに変換し、IDごとに aws_instance の情報を取得します。
for_each は、プログラムでいう「for文」のようなものであり、この定義を書くことで対象の数だけデータ取得を行います。
また、aws_instancesで生成されるデータは「リスト型」になっています。
for_eachでは「マップ型」もしくは「セット型」のデータ型が必要になるため、tosetでデータ型の変換を行う必要があります。
# 1) 全てのインスタンスのIDを取得する
data "aws_instances" "targets" {
  instance_state_names = ["pending", "running", "stopped", "stopping"]
}

# 2) 個別のインスタンスの詳細情報を取得する
data "aws_instance" "detail" {
  for_each = toset(data.aws_instances.targets.ids)
  instance_id = each.key
}
- main.tf
main.tfでは、aws_instanceで取得したネームタグの情報を加工し、CloudWatchアラームを作成する処理を行います。
localsのブロックでは、以下のような処理を行なっています。
・タグを確認して除外対象のEC2インスタンスのフィルタリング
・”-”区切りになっているEC2インスタンスの末尾の文字列を抽出
・EC2インスタンスの末尾の文字列をCloudWatch アラームの名前に含める
localブロックでCloudWatchアラームに使用する名前のmapを作成する下処理を行なった後、for_eachを使用して複数のCloudWatchアラームを作成する流れになっています。
locals {
  eligible_instances = {
    for id, inst in data.aws_instance.detail :
    id => inst
    if try(inst.tags[var.exclude_tag_key] != var.exclude_tag_value, true)
  }
  instance_suffix_map = {
    for id, inst in local.eligible_instances : id => coalesce(try(element(split("-", inst.tags["Name"]), 2), null), id)
  }
  alarm_name_map = {
    for id, nm in local.instance_suffix_map : id => format("cpu-high-%s", nm)
  }
}

resource "aws_cloudwatch_metric_alarm" "cpu_high" {
  for_each            = local.alarm_name_map
  alarm_name          = each.value
  alarm_description   = "CPU utilization high on instance ${local.instance_suffix_map[each.key]}"
  namespace           = "AWS/EC2"
  metric_name         = "CPUUtilization"
  statistic           = "Average"
  period              = 60
  evaluation_periods  = 5
  datapoints_to_alarm = 3
  threshold           = 80
  comparison_operator = "GreaterThanThreshold"
  treat_missing_data  = "notBreaching"

  dimensions = {
    InstanceId = each.key
  }
}動作確認
以上、作成したterraformでTerraform applyを実行します。
% terraform apply
data.aws_instances.targets: Reading...
data.aws_instances.targets: Read complete after 0s [id=ap-northeast-1]
data.aws_instance.detail["i-0c0adcdf042bef383"]: Reading...
data.aws_instance.detail["i-09b384b006fad22f2"]: Reading...
data.aws_instance.detail["i-0e9761f58cdce885f"]: Reading...
data.aws_instance.detail["i-03a5579512d57ac6f"]: Reading...
data.aws_instance.detail["i-0513fbd900f0eb035"]: Reading...
data.aws_instance.detail["i-0c0adcdf042bef383"]: Read complete after 1s [id=i-0c0adcdf042bef383]
data.aws_instance.detail["i-0513fbd900f0eb035"]: Read complete after 1s [id=i-0513fbd900f0eb035]
data.aws_instance.detail["i-03a5579512d57ac6f"]: Read complete after 1s [id=i-03a5579512d57ac6f]
data.aws_instance.detail["i-09b384b006fad22f2"]: Read complete after 1s [id=i-09b384b006fad22f2]
data.aws_instance.detail["i-0e9761f58cdce885f"]: Read complete after 1s [id=i-0e9761f58cdce885f]

Terraform used the selected providers to generate the following execution plan. Resource actions are indicated with the following symbols:
  + create

Terraform will perform the following actions:

  # aws_cloudwatch_metric_alarm.cpu_high["i-03a5579512d57ac6f"] will be created
  + resource "aws_cloudwatch_metric_alarm" "cpu_high" {
      + actions_enabled                       = true
      + alarm_description                     = "CPU utilization high on ec2-instance-03"
      + alarm_name                            = "cpu-high-03"
      + arn                                   = (known after apply)
      + comparison_operator                   = "GreaterThanThreshold"
      + datapoints_to_alarm                   = 3
      + dimensions                            = {
          + "InstanceId" = "i-03a5579512d57ac6f"
        }
      + evaluate_low_sample_count_percentiles = (known after apply)
      + evaluation_periods                    = 5
      + id                                    = (known after apply)
      + metric_name                           = "CPUUtilization"
      + namespace                             = "AWS/EC2"
      + period                                = 60
      + region                                = "ap-northeast-1"
      + statistic                             = "Average"
      + tags_all                              = (known after apply)
      + threshold                             = 80
      + treat_missing_data                    = "notBreaching"
    }

  # aws_cloudwatch_metric_alarm.cpu_high["i-0513fbd900f0eb035"] will be created
  + resource "aws_cloudwatch_metric_alarm" "cpu_high" {
      + actions_enabled                       = true
      + alarm_description                     = "CPU utilization high on ec2-instance-01"
      + alarm_name                            = "cpu-high-01"
      + arn                                   = (known after apply)
      + comparison_operator                   = "GreaterThanThreshold"
      + datapoints_to_alarm                   = 3
      + dimensions                            = {
          + "InstanceId" = "i-0513fbd900f0eb035"
        }
      + evaluate_low_sample_count_percentiles = (known after apply)
      + evaluation_periods                    = 5
      + id                                    = (known after apply)
      + metric_name                           = "CPUUtilization"
      + namespace                             = "AWS/EC2"
      + period                                = 60
      + region                                = "ap-northeast-1"
      + statistic                             = "Average"
      + tags_all                              = (known after apply)
      + threshold                             = 80
      + treat_missing_data                    = "notBreaching"
    }

  # aws_cloudwatch_metric_alarm.cpu_high["i-09b384b006fad22f2"] will be created
  + resource "aws_cloudwatch_metric_alarm" "cpu_high" {
      + actions_enabled                       = true
      + alarm_description                     = "CPU utilization high on ec2-instance-04"
      + alarm_name                            = "cpu-high-04"
      + arn                                   = (known after apply)
      + comparison_operator                   = "GreaterThanThreshold"
      + datapoints_to_alarm                   = 3
      + dimensions                            = {
          + "InstanceId" = "i-09b384b006fad22f2"
        }
      + evaluate_low_sample_count_percentiles = (known after apply)
      + evaluation_periods                    = 5
      + id                                    = (known after apply)
      + metric_name                           = "CPUUtilization"
      + namespace                             = "AWS/EC2"
      + period                                = 60
      + region                                = "ap-northeast-1"
      + statistic                             = "Average"
      + tags_all                              = (known after apply)
      + threshold                             = 80
      + treat_missing_data                    = "notBreaching"
    }

  # aws_cloudwatch_metric_alarm.cpu_high["i-0c0adcdf042bef383"] will be created
  + resource "aws_cloudwatch_metric_alarm" "cpu_high" {
      + actions_enabled                       = true
      + alarm_description                     = "CPU utilization high on ec2-instance-02"
      + alarm_name                            = "cpu-high-02"
      + arn                                   = (known after apply)
      + comparison_operator                   = "GreaterThanThreshold"
      + datapoints_to_alarm                   = 3
      + dimensions                            = {
          + "InstanceId" = "i-0c0adcdf042bef383"
        }
      + evaluate_low_sample_count_percentiles = (known after apply)
      + evaluation_periods                    = 5
      + id                                    = (known after apply)
      + metric_name                           = "CPUUtilization"
      + namespace                             = "AWS/EC2"
      + period                                = 60
      + region                                = "ap-northeast-1"
      + statistic                             = "Average"
      + tags_all                              = (known after apply)
      + threshold                             = 80
      + treat_missing_data                    = "notBreaching"
    }

Plan: 4 to add, 0 to change, 0 to destroy.今回の例ではインスタンス5台のうち、除外タグがついているインスタンスが1台あるので、作成されるアラームが4つになっています。
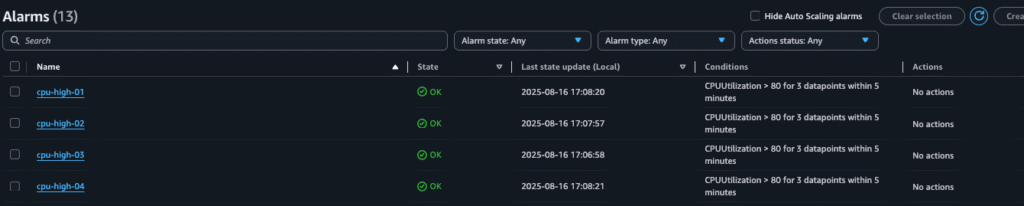
Cloudwatchアラームも4つ作成されており、EC2インスタンスの末尾の数字がアラームに使われていることがわかります。

コメント